
Here's the new chart:
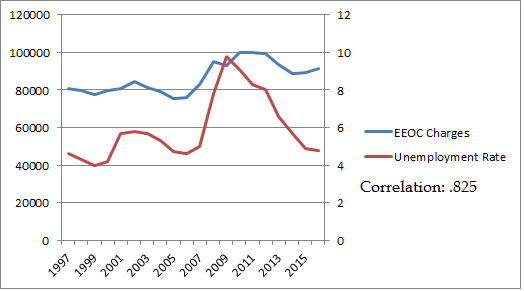
Here's the data:
| Year | EEOC Charges | Unemployment Rate |
| 1997 | 80680 | 4.6 |
| 1998 | 79591 | 4.3 |
| 1999 | 77444 | 4 |
| 2000 | 79896 | 4.2 |
| 2001 | 80840 | 5.7 |
| 2002 | 84442 | 5.8 |
| 2003 | 81293 | 5.7 |
| 2004 | 79432 | 5.3 |
| 2005 | 75428 | 4.7 |
| 2006 | 75768 | 4.6 |
| 2007 | 82792 | 5 |
| 2008 | 95402 | 7.8 |
| 2009 | 93277 | 9.8 |
| 2010 | 99922 | 9.1 |
| 2011 | 99947 | 8.3 |
| 2012 | 99412 | 8 |
| 2013 | 93727 | 6.6 |
| 2014 | 88778 | 5.7 |
| 2015 | 89385 | 4.9 |
| 2016 | 91503 | 4.8 |
For the unemployment rate, I used the rate as of January for the following year (e.g. as of January 2017 the rate was 4.8 so I used that as the rate for 2016). One could argue for something more nuanced (perhaps an average rate across the year?). Also, for EEOC charge statistics . . . we should presumably see some increase over time based solely on an increase in the population. Perhaps charting charges as a percentage of population?
In any event, the correlation was not quite as strong after factoring in the past few years, but still clearly exists. One day I may dig a little deeper into the data.

No comments:
Post a Comment