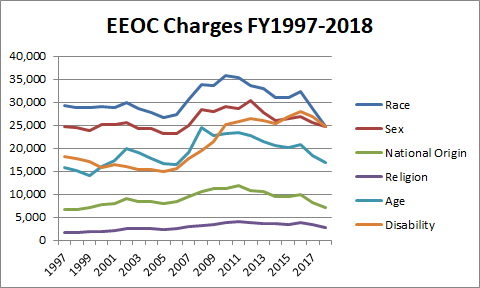
Charges are down across the board for the second year in a row. Over two years, we've seen some fairly significant drops. For example, race-based charges are down 23.9% since 2016.
What about the #MeToo movement? Has that had an impact on harassment claims? Let's go to the numbers:
Charges Alleging Sex-Based Harassment (Charges filed with EEOC)FY 2010 - FY 2018
| 2010 | 7,944 |
| 2011 | 7,809 |
| 2012 | 7,571 |
| 2013 | 7,256 |
| 2014 | 6,862 |
| 2015 | 6,822 |
| 2016 | 6,758 |
| 2017 | 6,696 |
| 2018 | 7,609 |
We see that the number of charges in 2018 was actually lower than 2010 and 2011. But, we also see a 13.6% jump from last year, and in a year in which all of the types of discrimination in the chart above decreased, that's noteworthy. Also, the percentage of claims filed by men (15.9%) was the lowest on the chart (going back to 2010). I think that's a pretty compelling case that #MeToo has had an impact.

No comments:
Post a Comment